What is a business without thorough analysis? This article covers all the features of the Statistics section and the elements you can monitor.
The Statistics section has five tabs:
Overview
Posting
Scenarios
Constructor
Entry — everything related to your multi-use, promo and referral links.
Let's look at each monitored element separately.
Overview
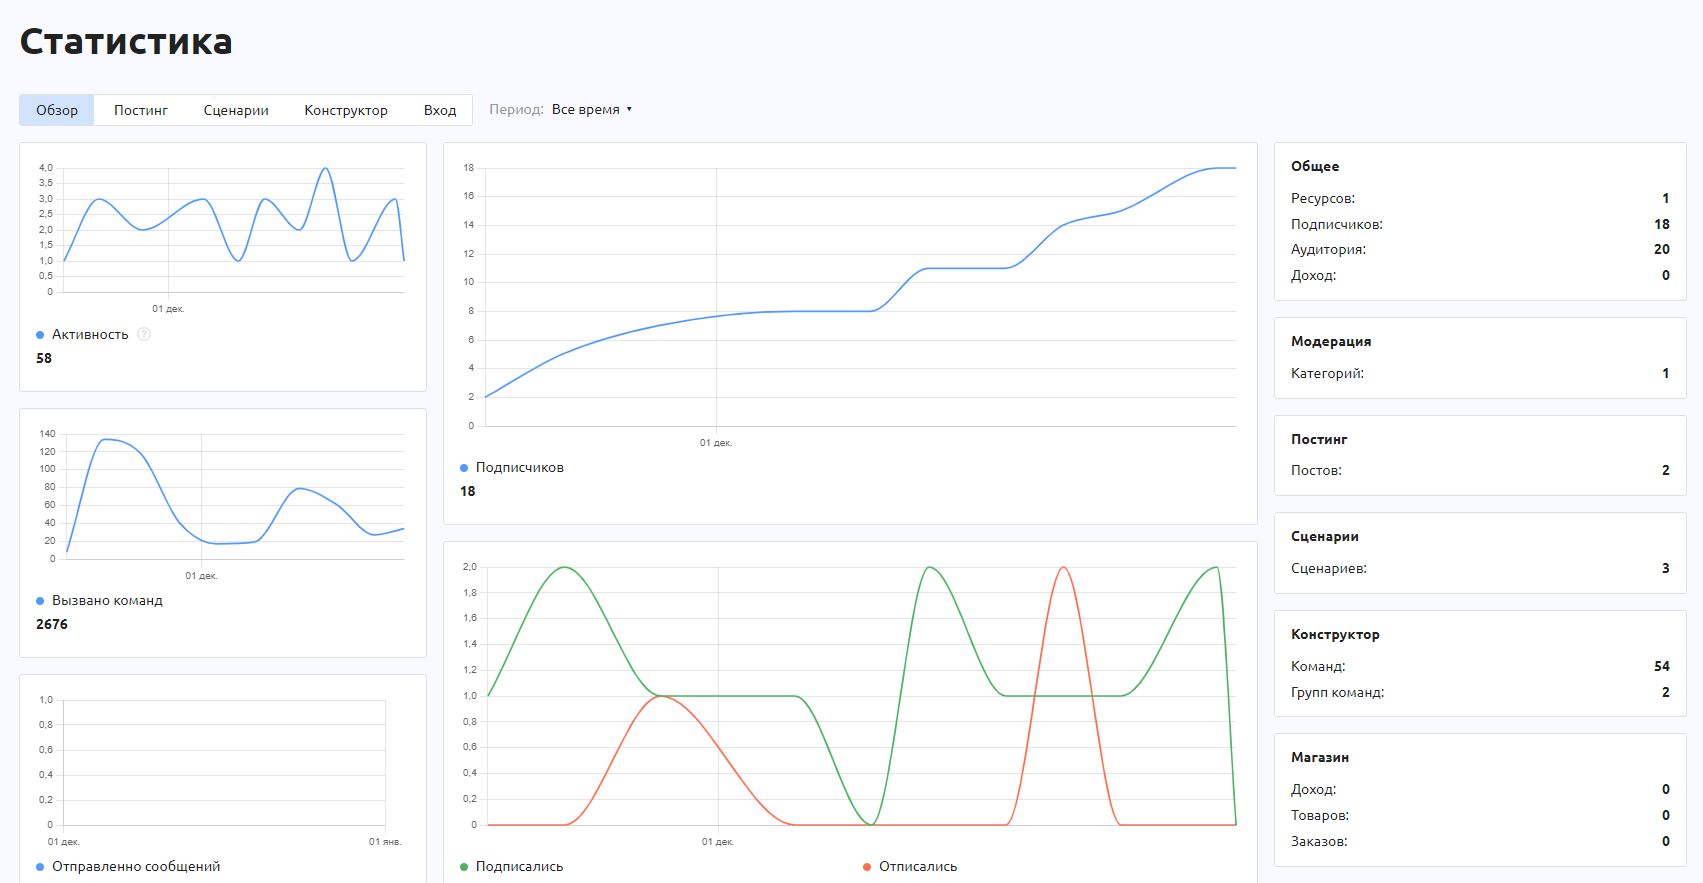
This page shows five line charts and a brief summary of the other sections. The charts are:
Subscriber activity.
Changes in the number of subscribers.
Changes in command calls.
Number of messages per day.
Subscriber inflow/outflow.
Line charts show quantitative values over a continuous interval or a specific time period, and the visual layout is the same everywhere:
The Name of the monitored element is in the top left corner.
Y axis — the scale of quantitative values (users, messages and so on).
X axis — the time interval or qualitative values.
Zooming in the visualization. You can drag the slider manually to view the chart segments you are interested in, and expand any chart to full screen.
Posting
The Posting section has three tabs:
Posts.
Polls.
Quizzes.
Let's look at each of them.
Posts
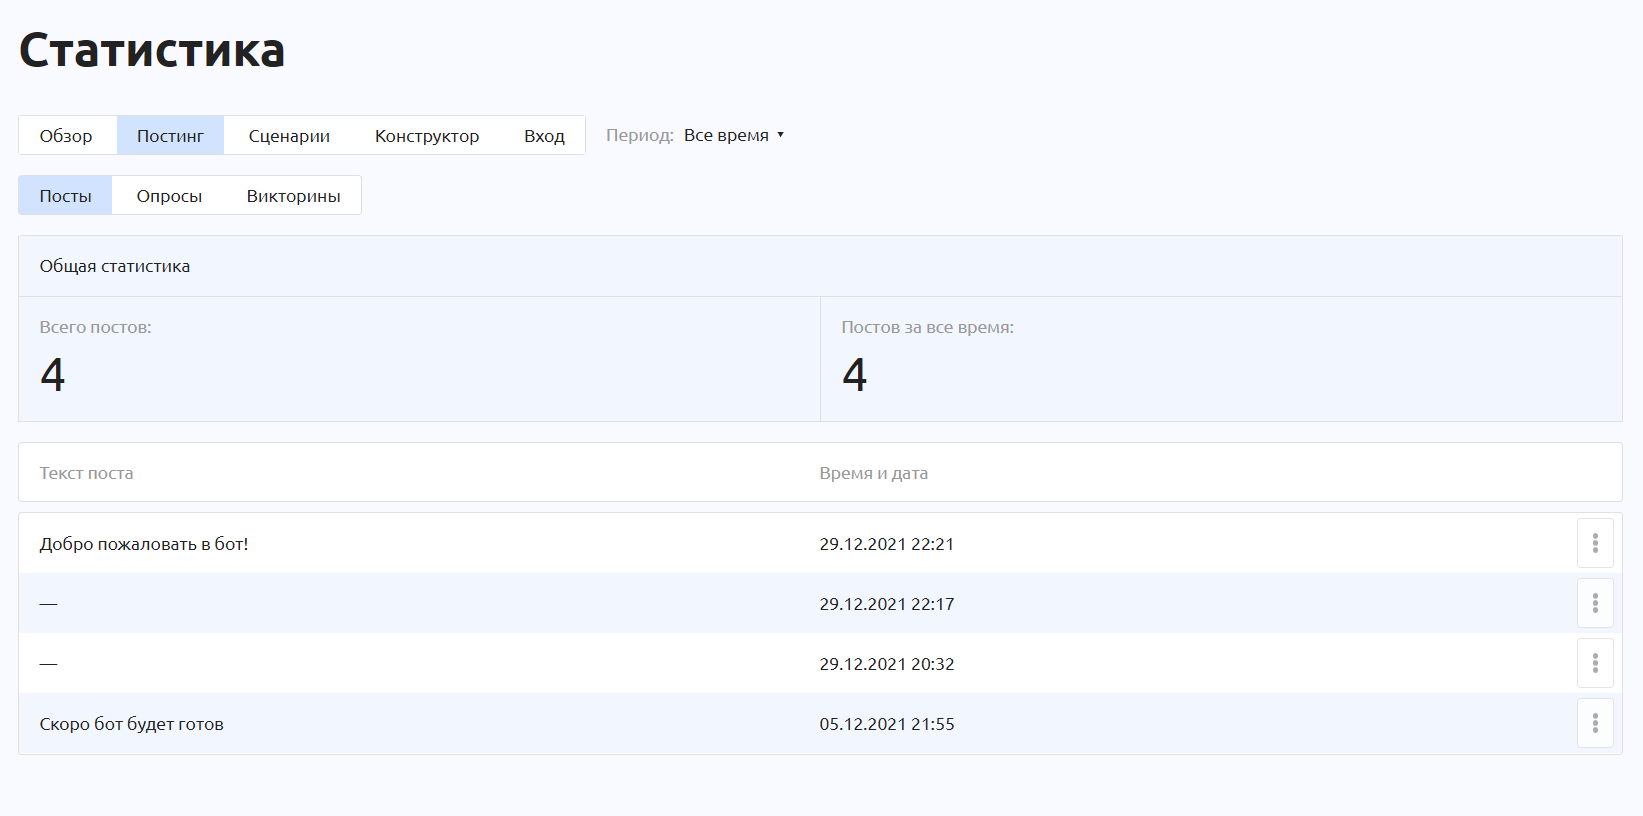
Shows a list of all posts sent from the Posting section with the send date and time.
Polls
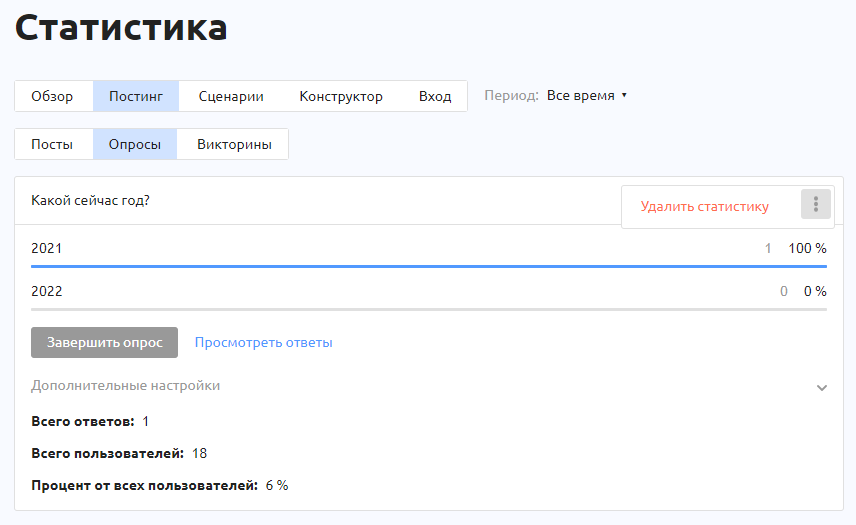
Shows all Polls run through Posting, along with answer statistics. To see users' answers, click View answers.
Quiz
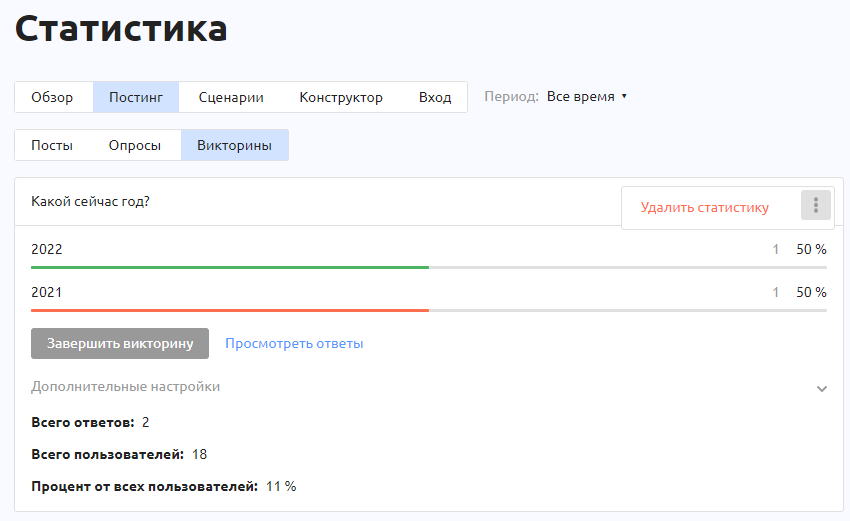
Shows all Quizzes run through Posting, including correct and incorrect answers. To see users' answers, click View answers.
Scenarios
This section includes statistics on Scenarios and on Posts within the scenarios.
Scenarios
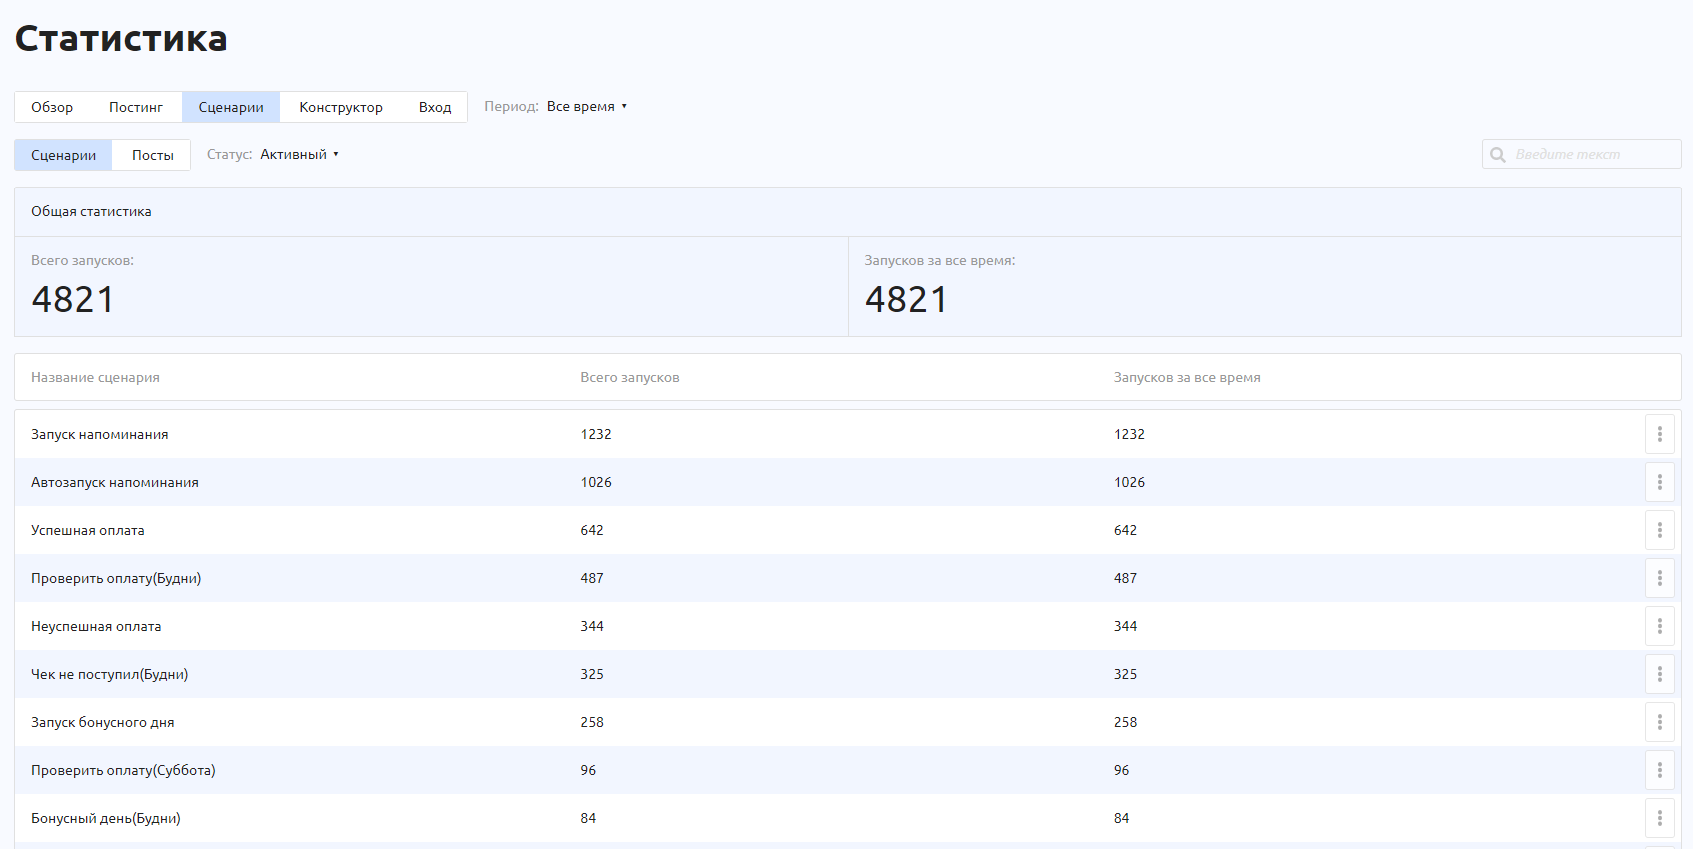
All scenarios and the number of times they were launched are shown here.
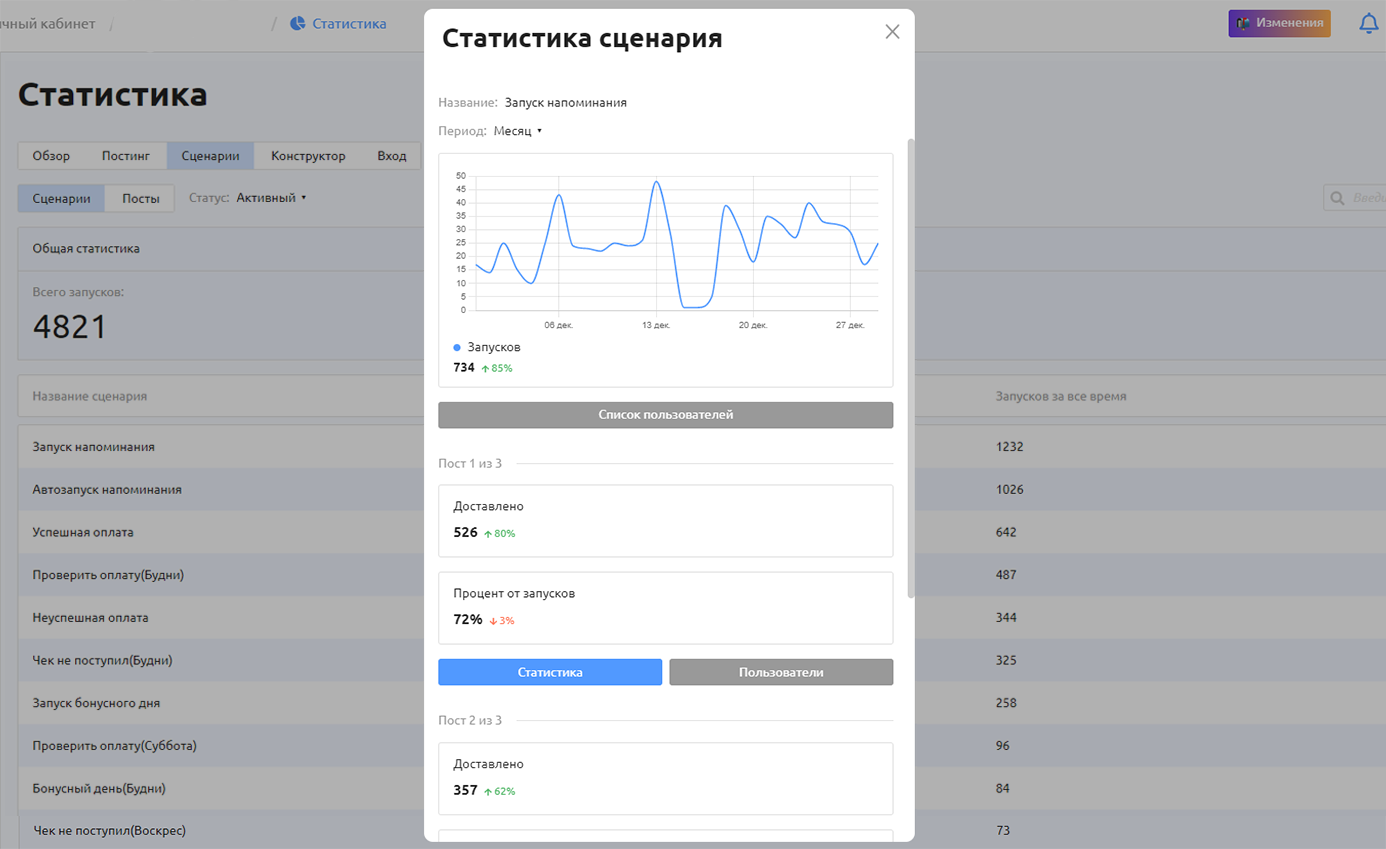
Next to each scenario, you can click the three dots and open Statistics, where you can select a period and see a chart of posts sent from the scenario. You can also view the list of users who launched the scenario and the list of users who received each of the scenario's posts.
Posts
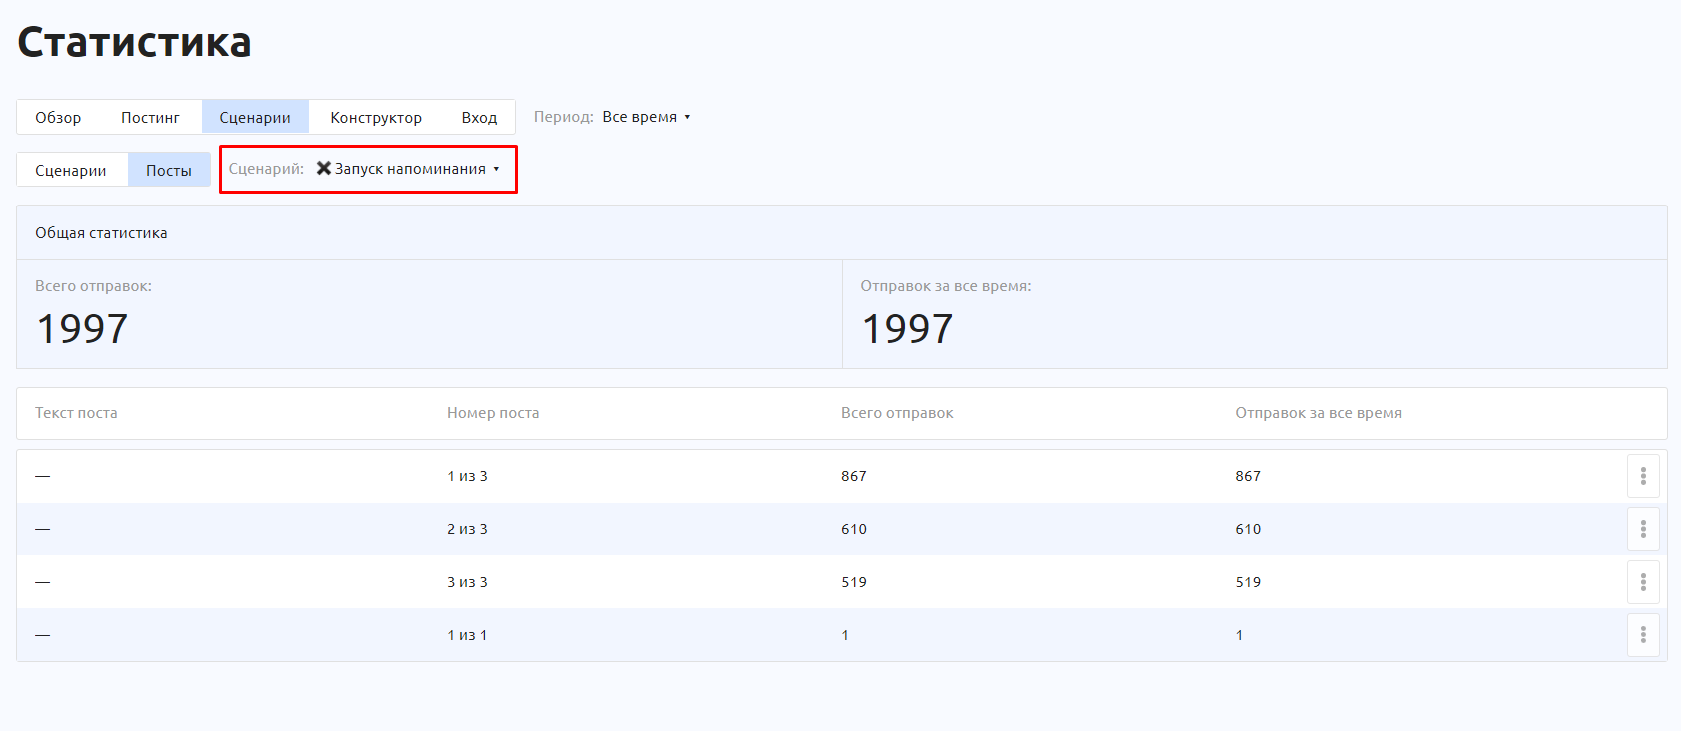
In the Posts section, you can select a specific scenario and get statistics for each post in it. Click the three dots next to a post to see a chart of post sends for the selected period and the list of users who received the post.
Constructor
This section has the following subsections:
Commands.
Mini apps.
Payments.
Input forms.
Commands
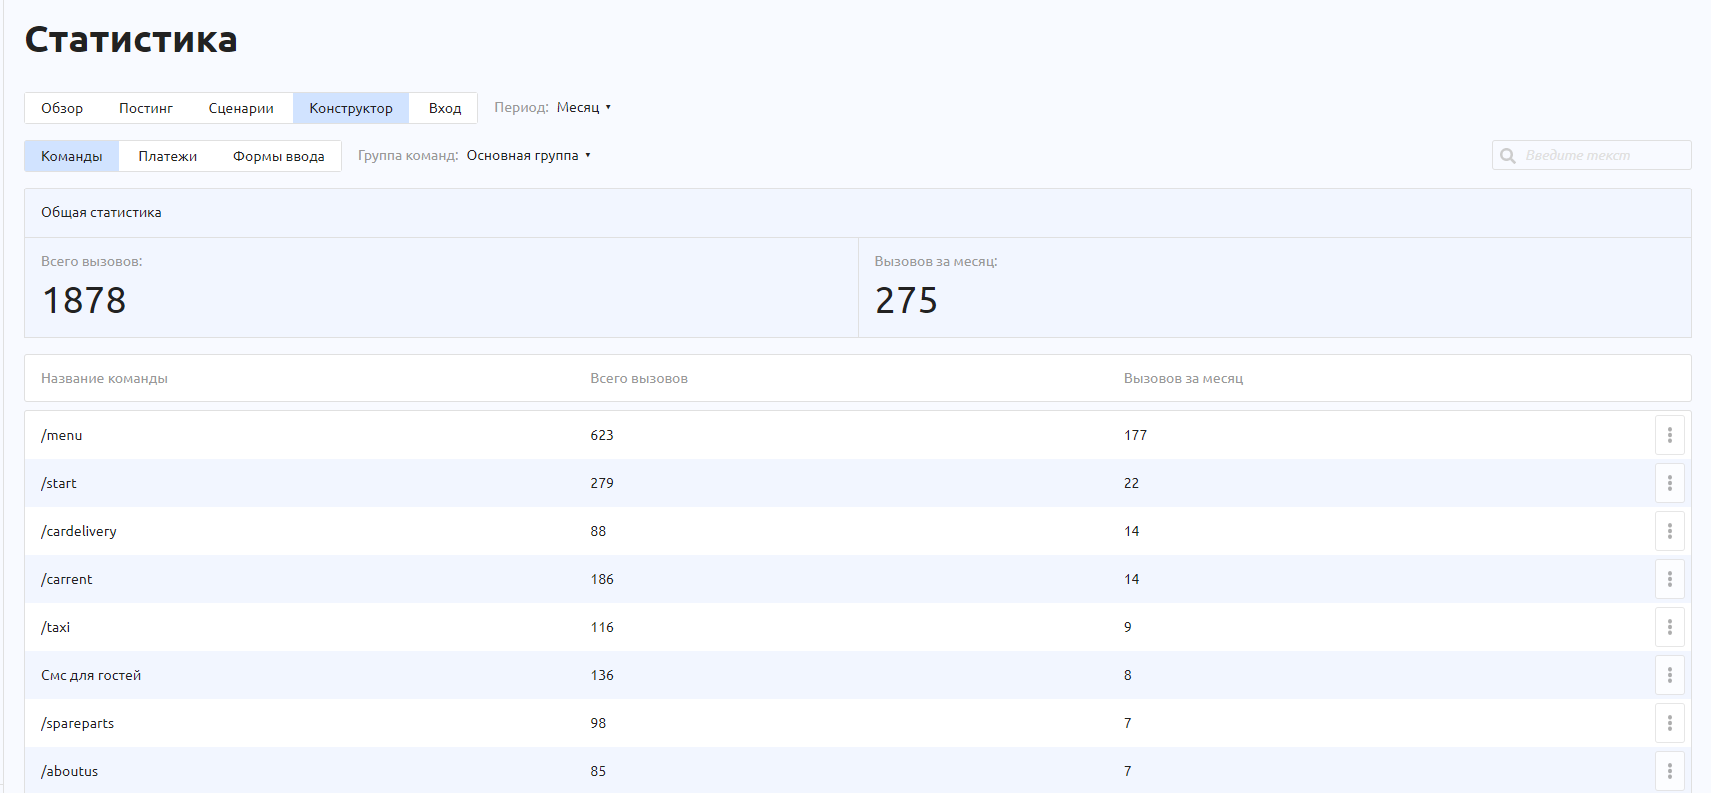
This section shows the commands that exist in the bot and the number of calls for all time and for the selected period.
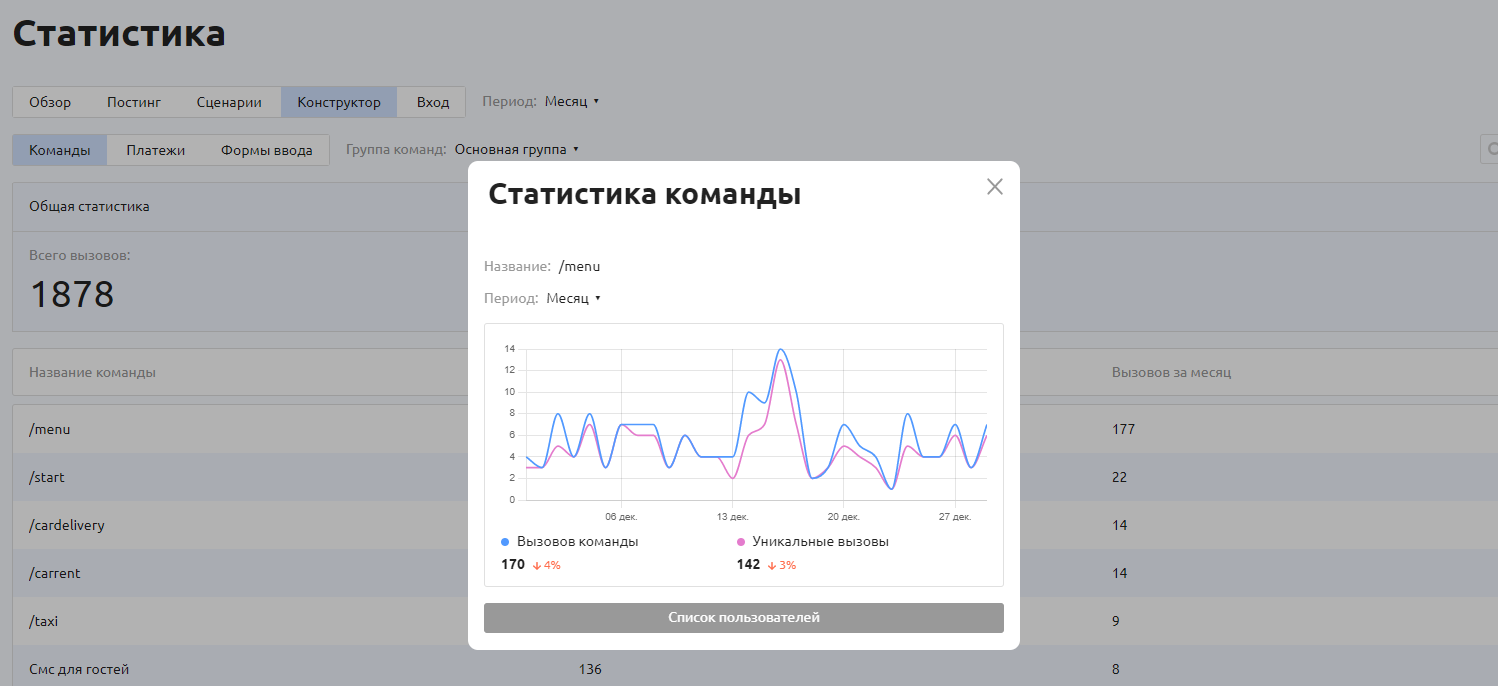
Click the three dots next to a command to open Command statistics, which shows a chart of total and unique calls of the command.
Mini apps
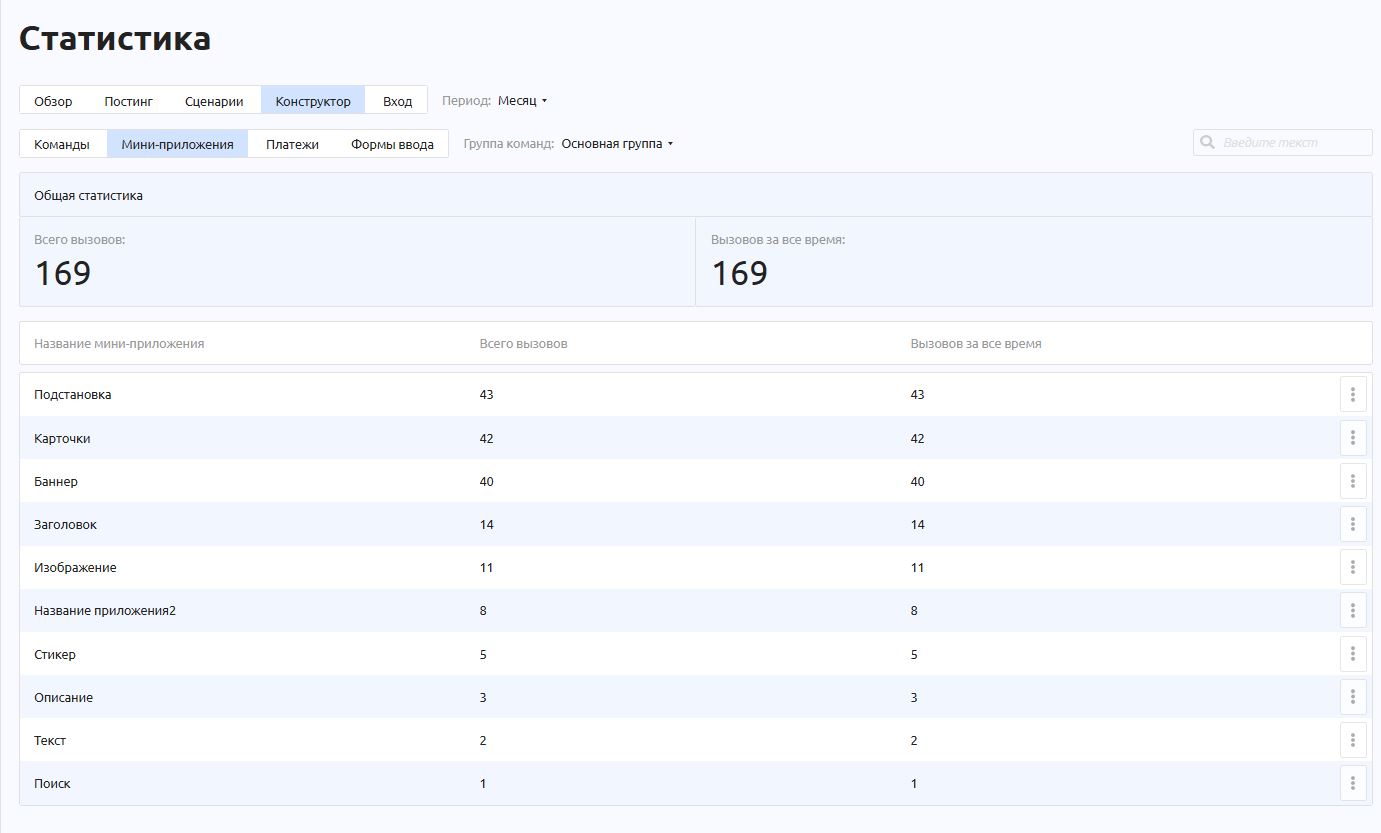
This section shows the mini apps that exist in the bot and the number of calls for all time and for the selected period.
Click the three dots next to a mini app name to open Statistics, which shows a chart of total and unique opens of the mini app.
Payments
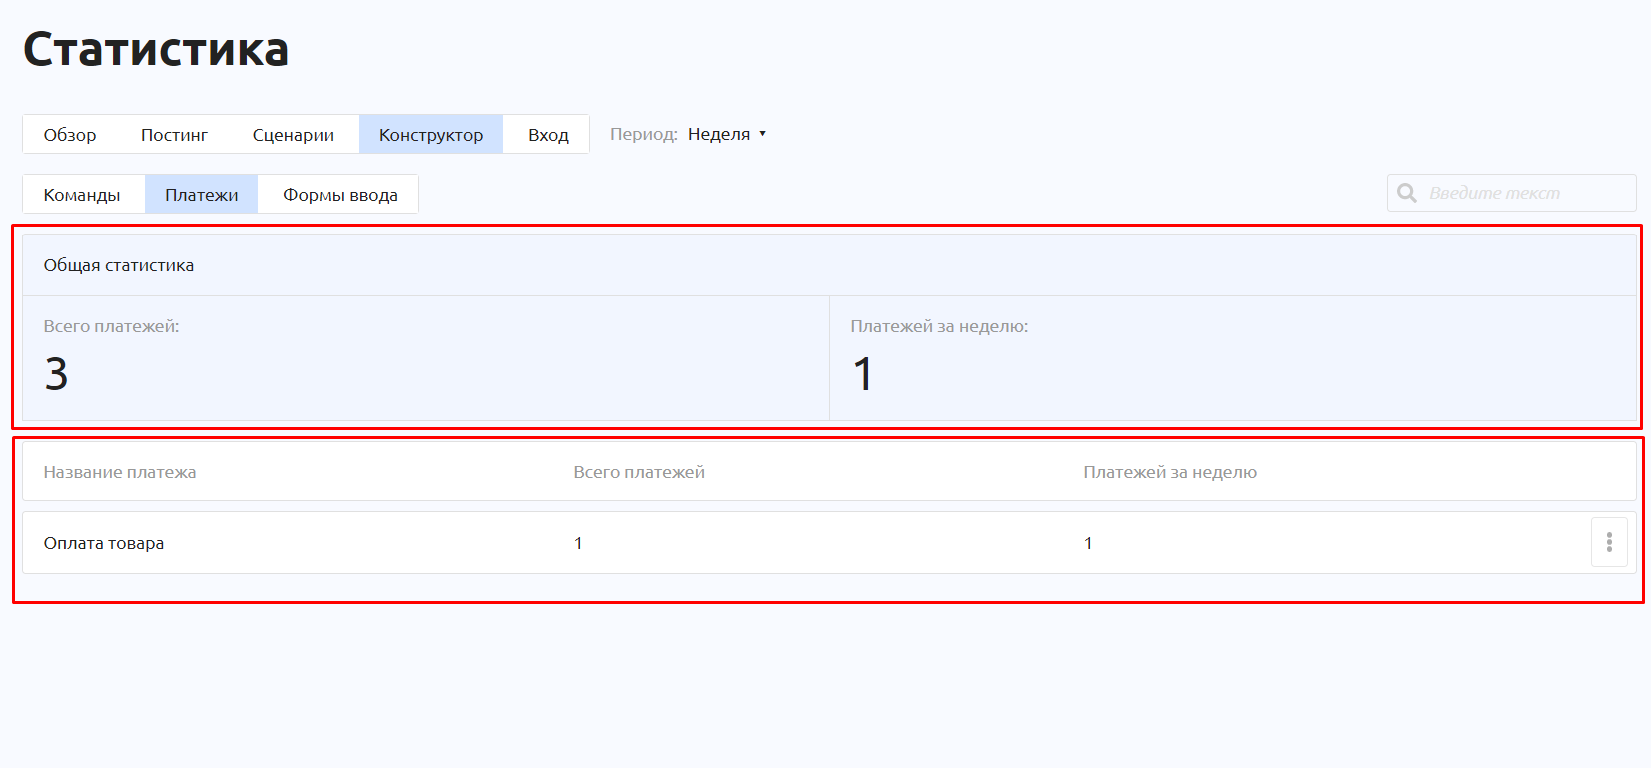
Monitoring of all received payments is split into two groups: overall statistics (at the top) and statistics for each payment separately (everything below). To open a detailed payment overview, click the three dots next to the payment.
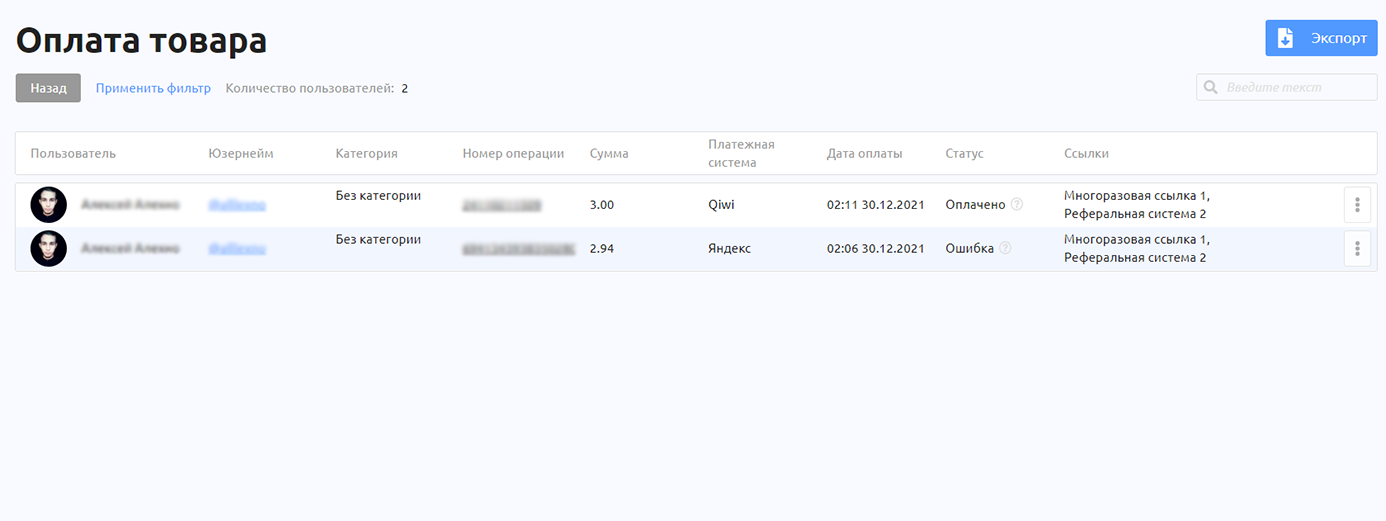
This table contains all incoming information about payment transactions. At the top of the page, you can filter payments by date and amount.
Each piece of payment information goes into its own column. There are 8 of them:
Users — the user's name.
Username.
Category.
Transaction number — a link to the electronic receipt in the payment system used.
Amount — after the commission is deducted.
Payment system.
Payment date.
Status.
Links.
Tip: when you create a payment button in the Constructor, try to give payments meaningful names. This makes it easy to tell payments apart and analyze them in the Statistics section.
Input forms
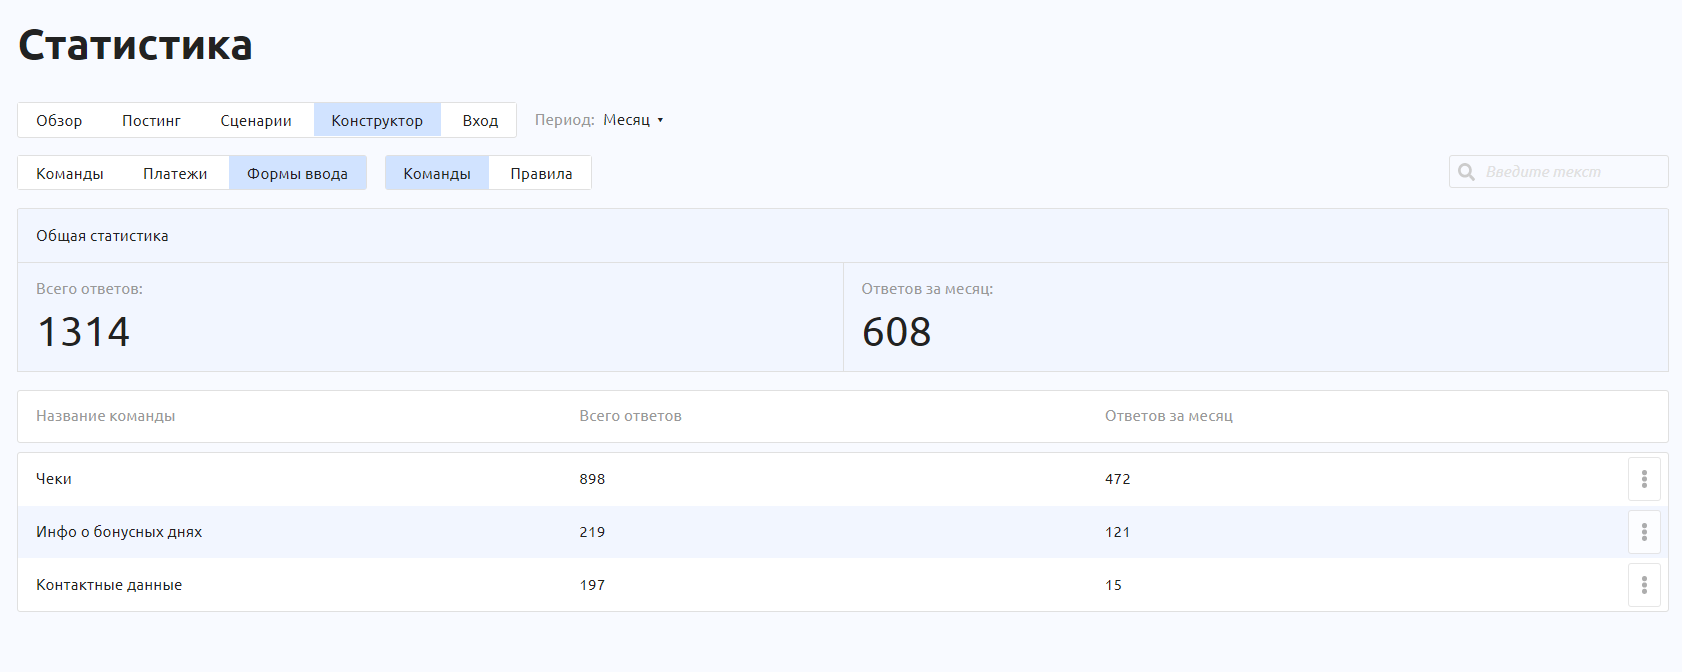
Select "Commands" or "Mini apps", depending on where the forms whose statistics you want to see are located. Or select "Rules" if answers to forms from different commands are combined in your input form notification settings.
The main input form statistics page shows:
Command/Mini app name — the specific command or mini app in which the input form block was created.
Total answers — the number of answers to the input form.
Answers per month — or for the period selected at the top of the page. You can select Week, Month, Year or All time.
By the way, if you delete a form in the Constructor, the following label is added to the form name in the statistics: (deleted)
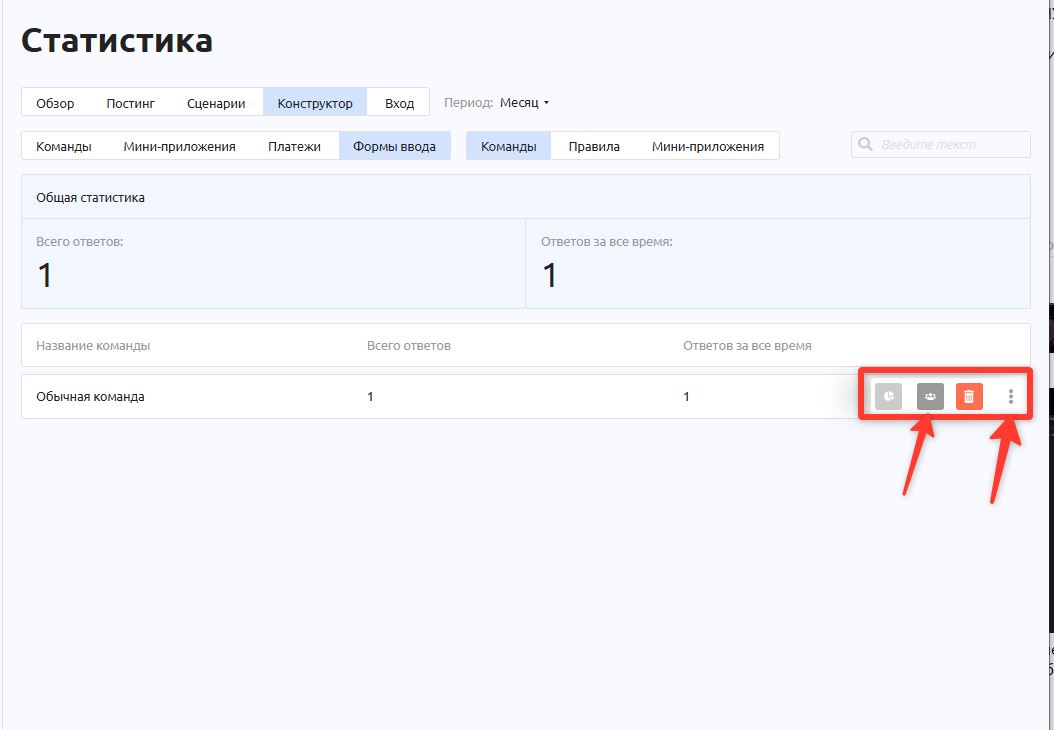
To open the answer details for a form or to delete all answers, click the three dots to the right of the form.
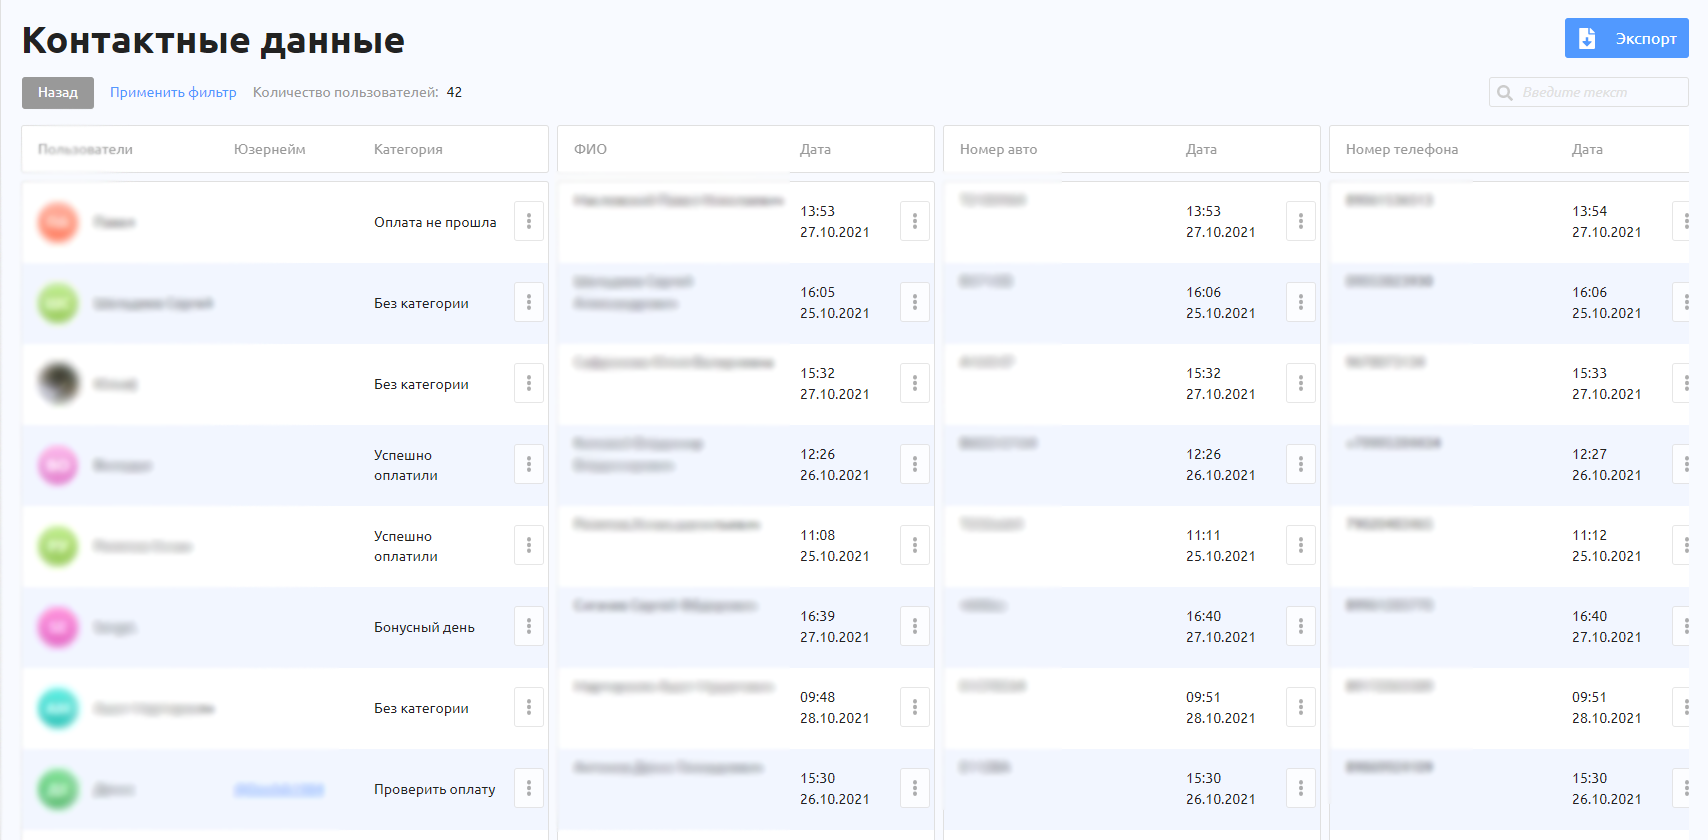
Unlike the payments table, the forms table has only 5 columns:
Users
Username
Category
Time and date
Input form answers
The number of columns shown depends on the number of input form blocks created in the command: with 1 block the table has 5 columns, with 2 blocks it has 7 columns.
If a user has more than one answer, click the Other answers button.
You can edit users' answers by clicking the three dots next to an answer.
Rules
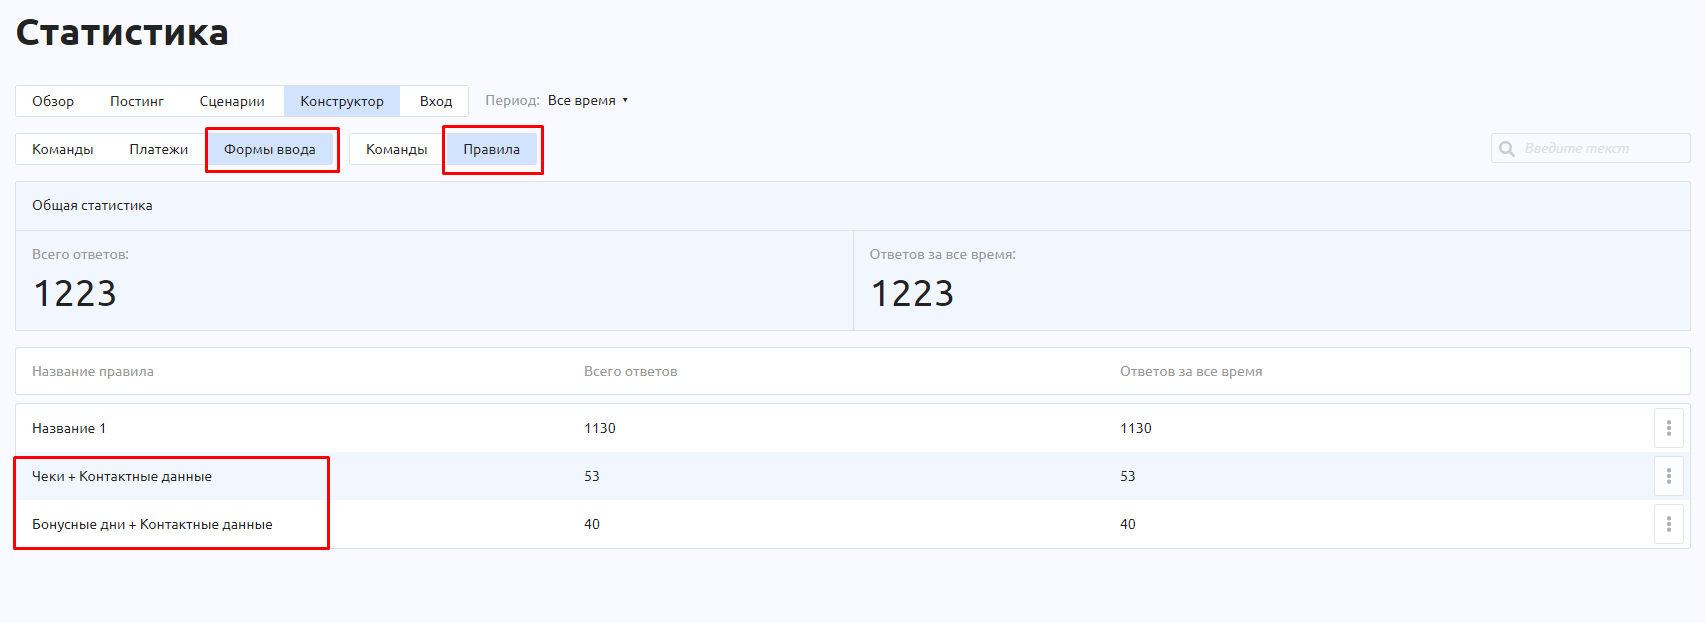
You can also get answer statistics for Rules. Everything works the same as for individual forms, except that the selected input forms are combined.
Entry
The Entry section shows click statistics for three types of links:
Multi-use links
Promo links
Referral system
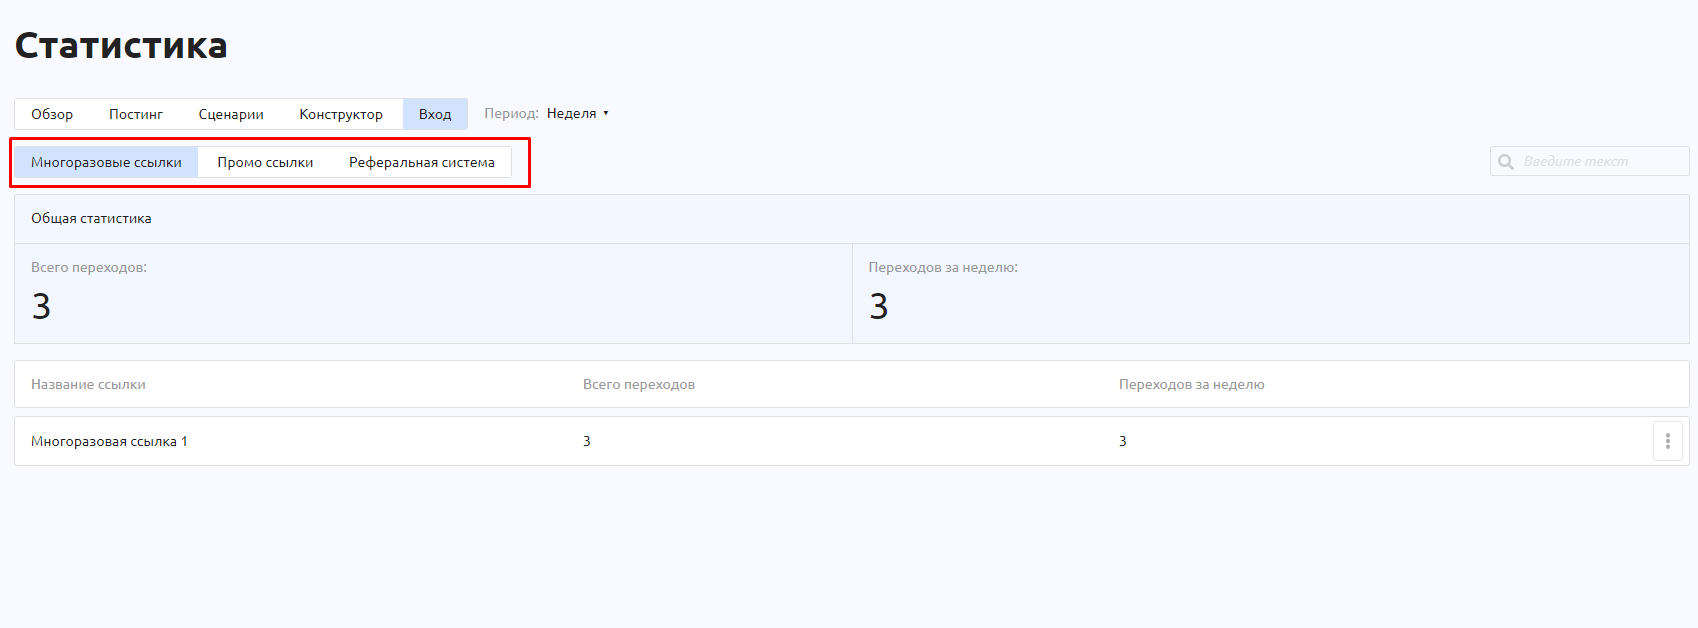
The lower part shows the list of created links. The upper part has a switch between link types, and for each type it shows the total number of clicks and the number of clicks for the selected period.
To open detailed information for a link, click the three dots to the right of it.
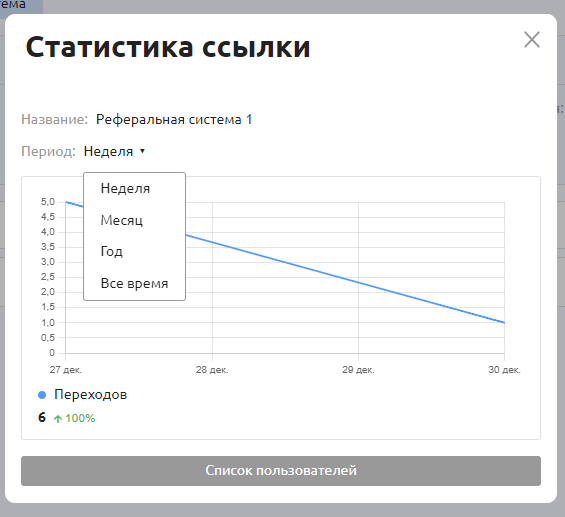
The chart shows the number of clicks for the selected period.
Click the User list button to see the list of users who followed the link.